Over the years, I have heard many people say something like
Over 50% of people think they are better than the average car driver.
They say this as if it’s funny or sounds smart. But the fact is that actually could be true, and the reason is because mean and median are not the same thing.
When people take a basic course in statistics, they are likely to come out of it thinking that the world mostly consists of normal distributions. That is not surprising, given that the Central Limit Theorem states that many independent variables with the same distribution converges to a normal distribution. This does not apply everywhere. The Central Limit Theorem means students leave Statistics 101 having a visual representation of a statistical distribution of a bell curve. I believe this has created a lot of confusion.
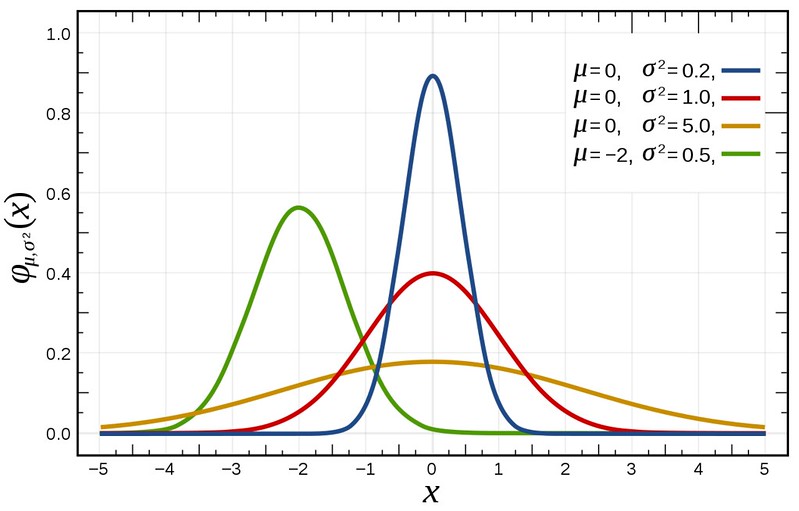
A big problem with thinking that all statistical distributions look like a bell curve is that it is symmetric along a vertical axis, the mean. This means that for a bell curve, the mean and median (or 50th percentile) are identical. In layman’s speak, 50% of the curve’s area is to the left (or to the right) of the mean. In the world of statistical distributions, this is an extreme outlier.
Most distributions do not have the same mean and median. See for example the following log-normal distributions where the blue and green lines do not coincide:
 (Log-normal distribution. (2023, October 2). In Wikipedia. https://en.wikipedia.org/wiki/Log-normal_distribution)
In the world of software, it can be very important to understand that percentiles (a median is the 50th percentile, remember?) can be significantly different from the mean. For example, latencies are rarely distributed according to a normal distribution. This means that while the average latency can look very promising, it still has significant outliers that kill the user experience.
The only time when averages for latency is useful is when talking about throughput. More on that in another article.